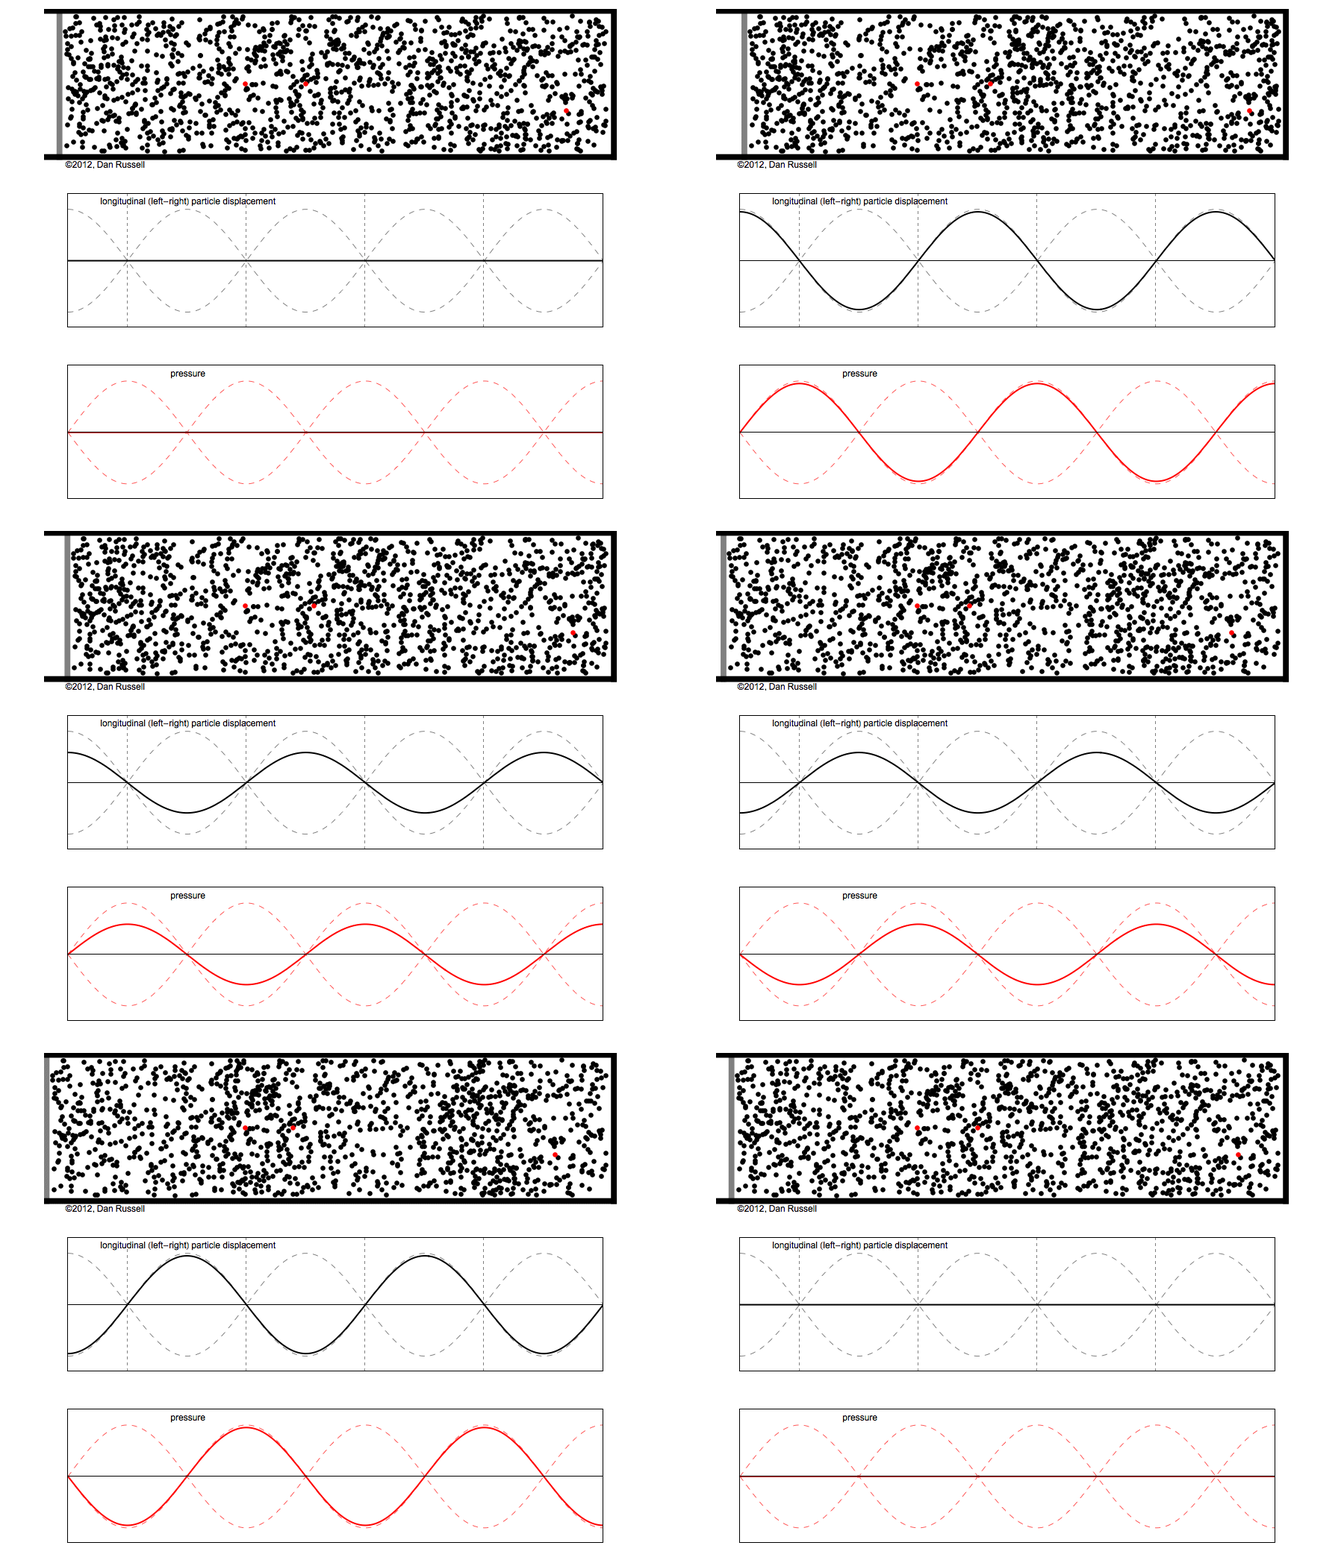
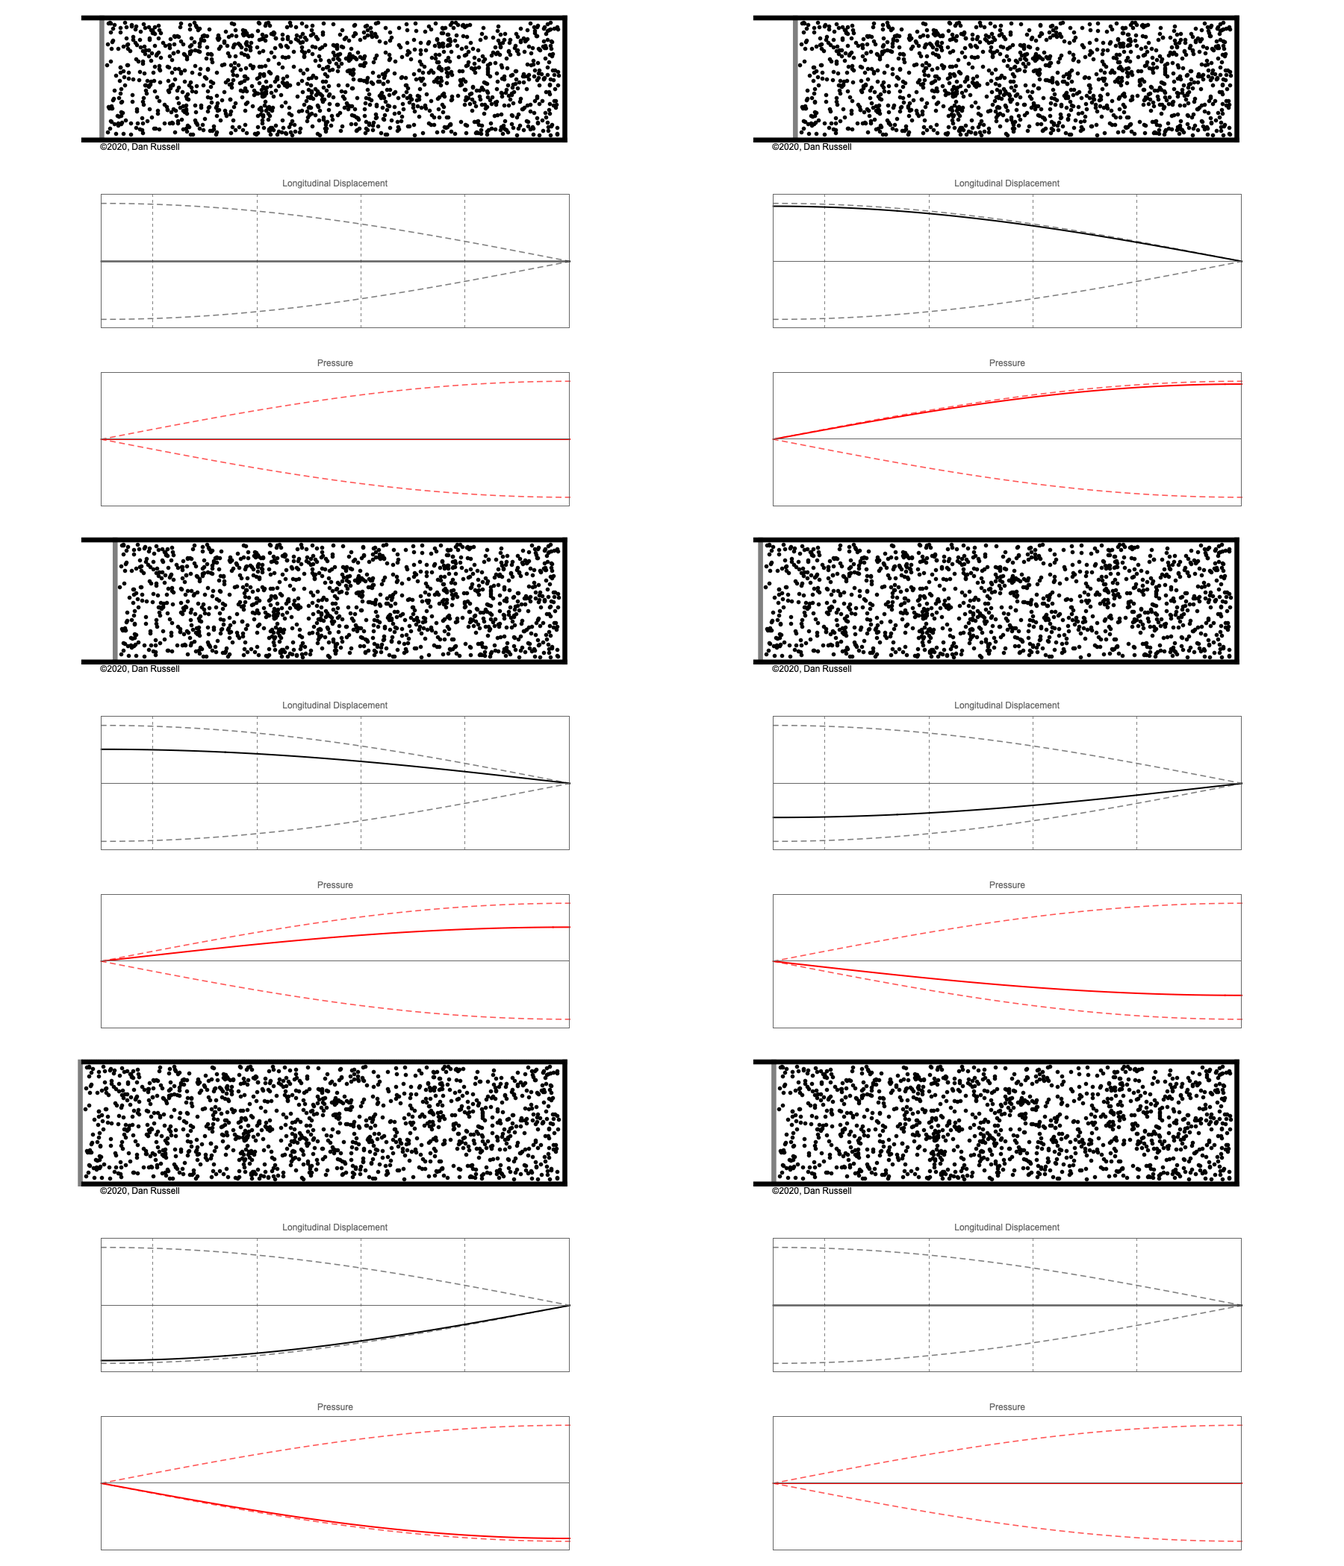
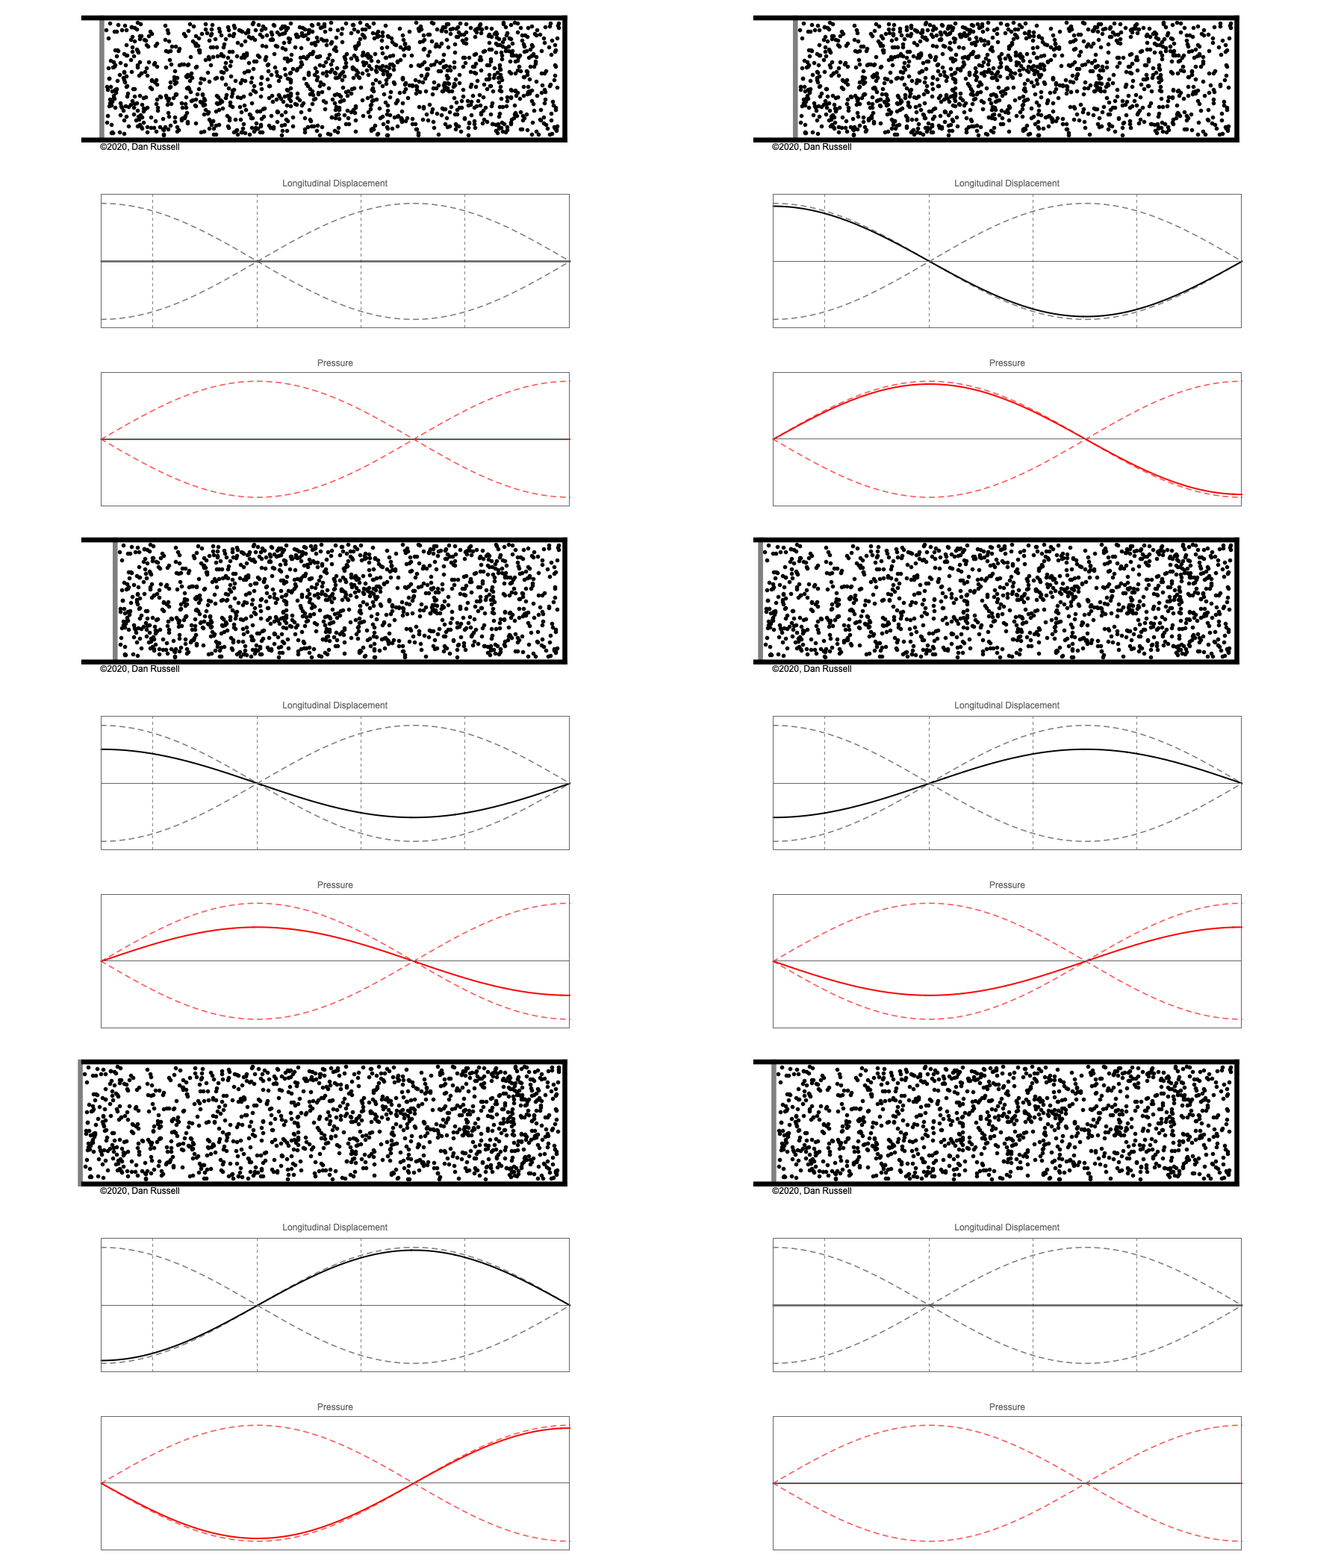
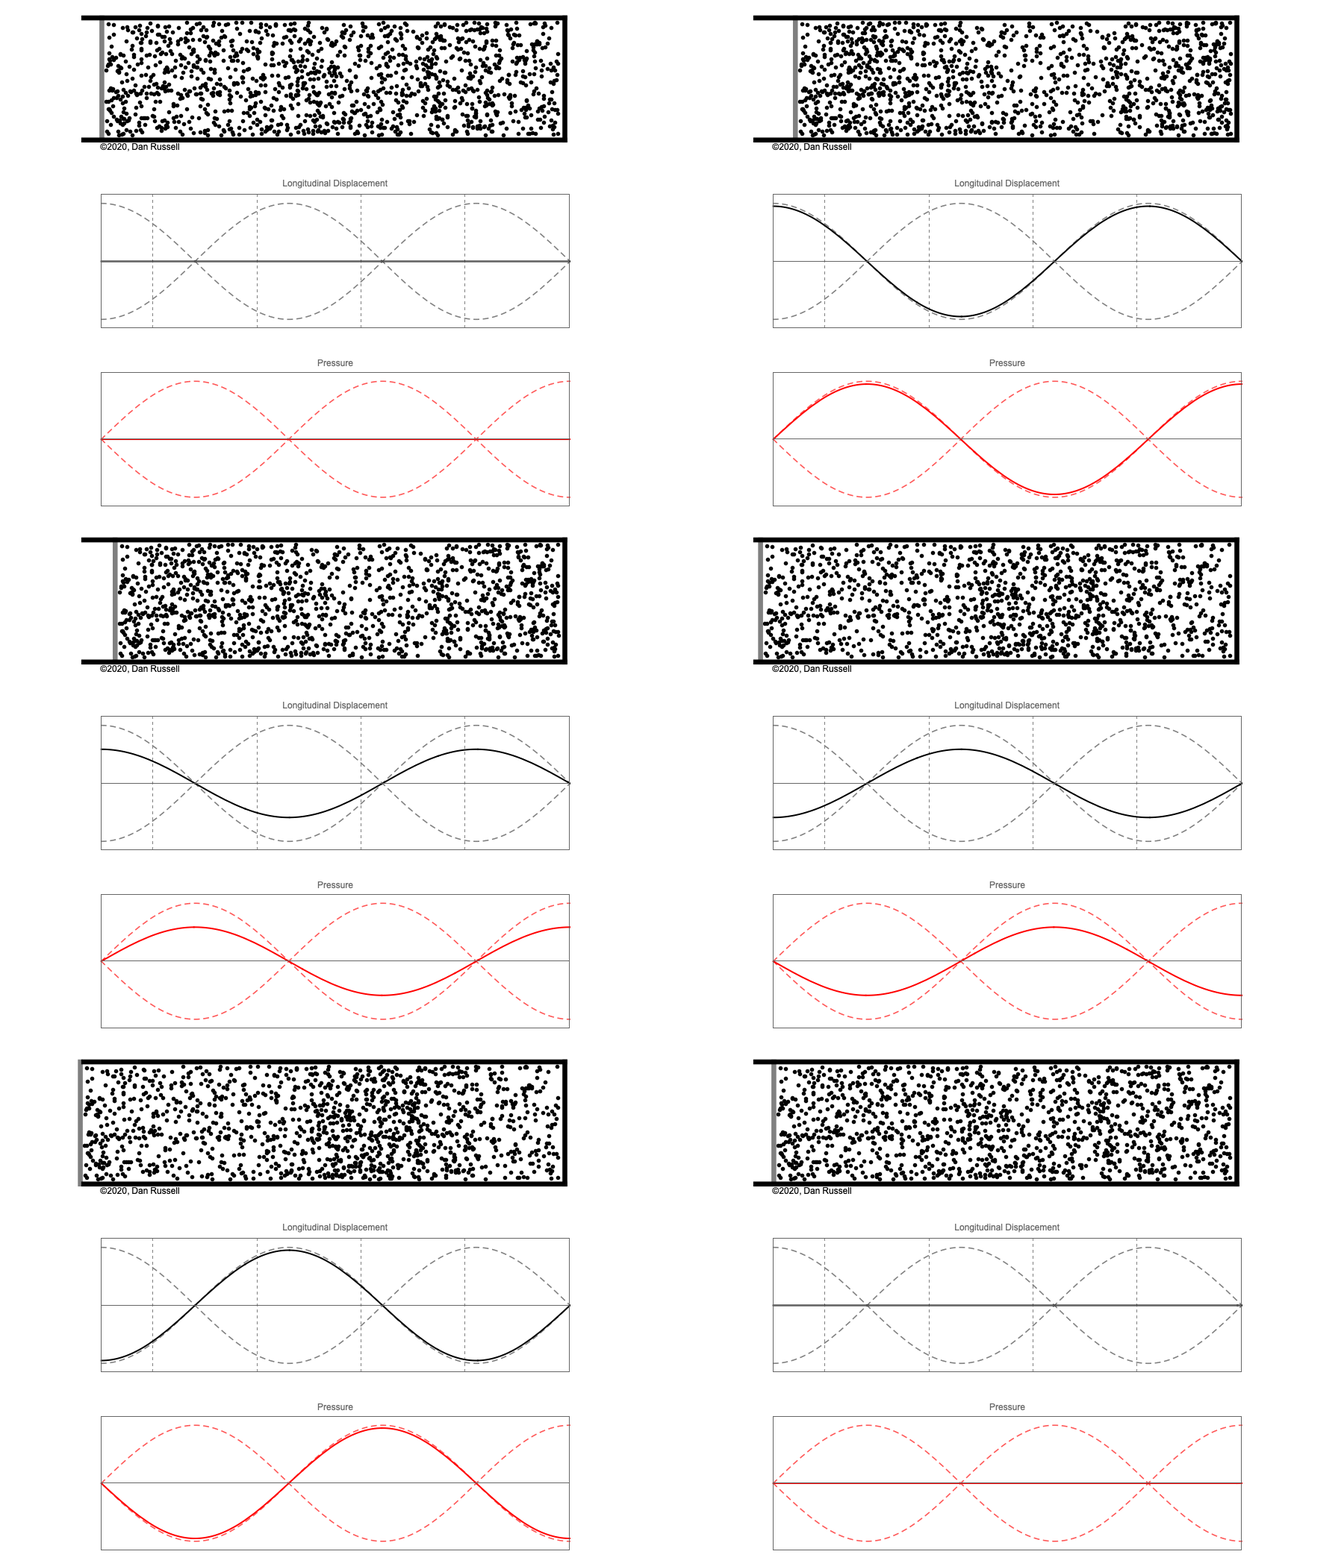
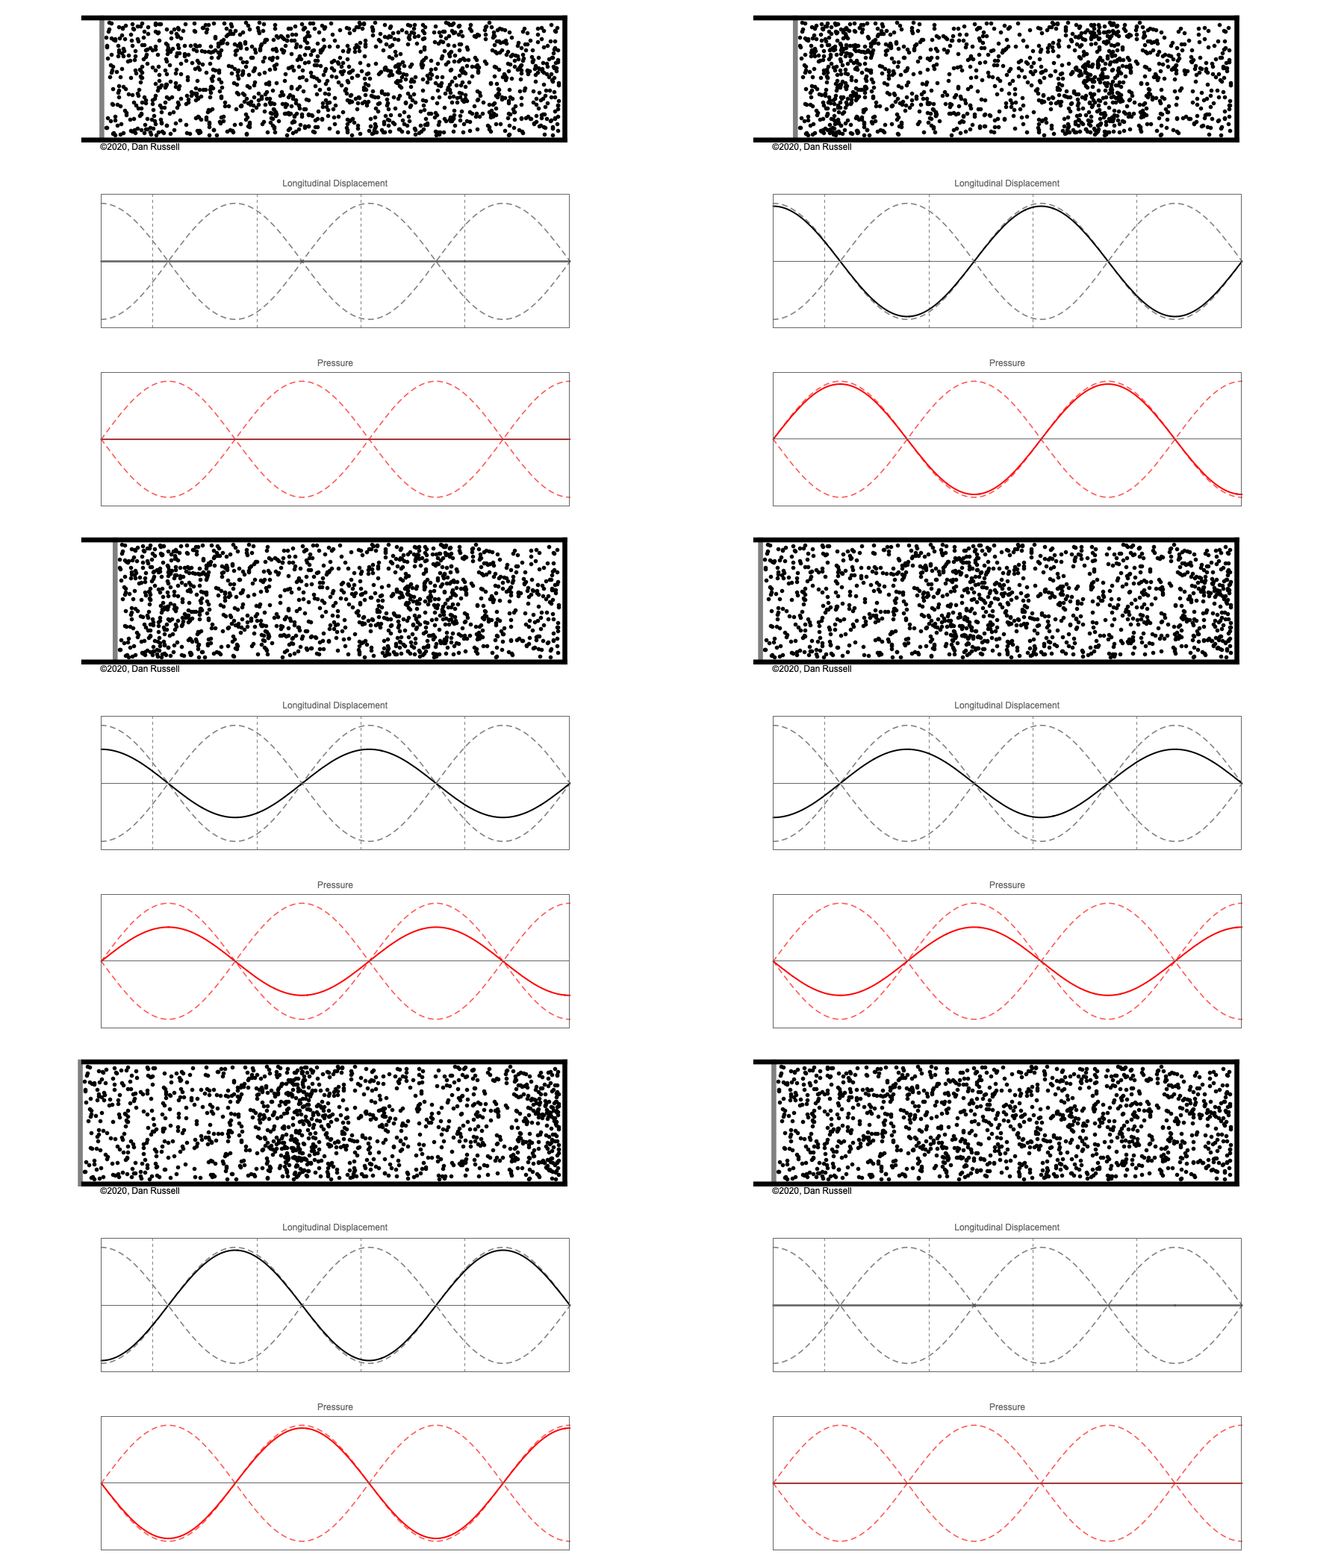
Standing Sound Waves (Longitudinal Standing Waves)
The problem: using static graphs to depict standing waves
 While teaching undergraduate physics at Kettering University for 16 years, I was often frustrated with the depiction of standing sound waves in pipes as it was presented in most elementary physics textbooks. Even textbooks specializing in wave phenomena were often not much better. Students are generally introduced to the concept of standing waves through a discussion of transverse standing waves on a string. Static images of standing waves on a fixed-fixed string are more readily understood intuitively because the static "graphs" showing standing wave patterns correspond directly to the transverse displacment of the string, as depicted in the animation shown. As the string moves up and down the displacement fits into the envelope of the static graphs representing the standing wave patterns.
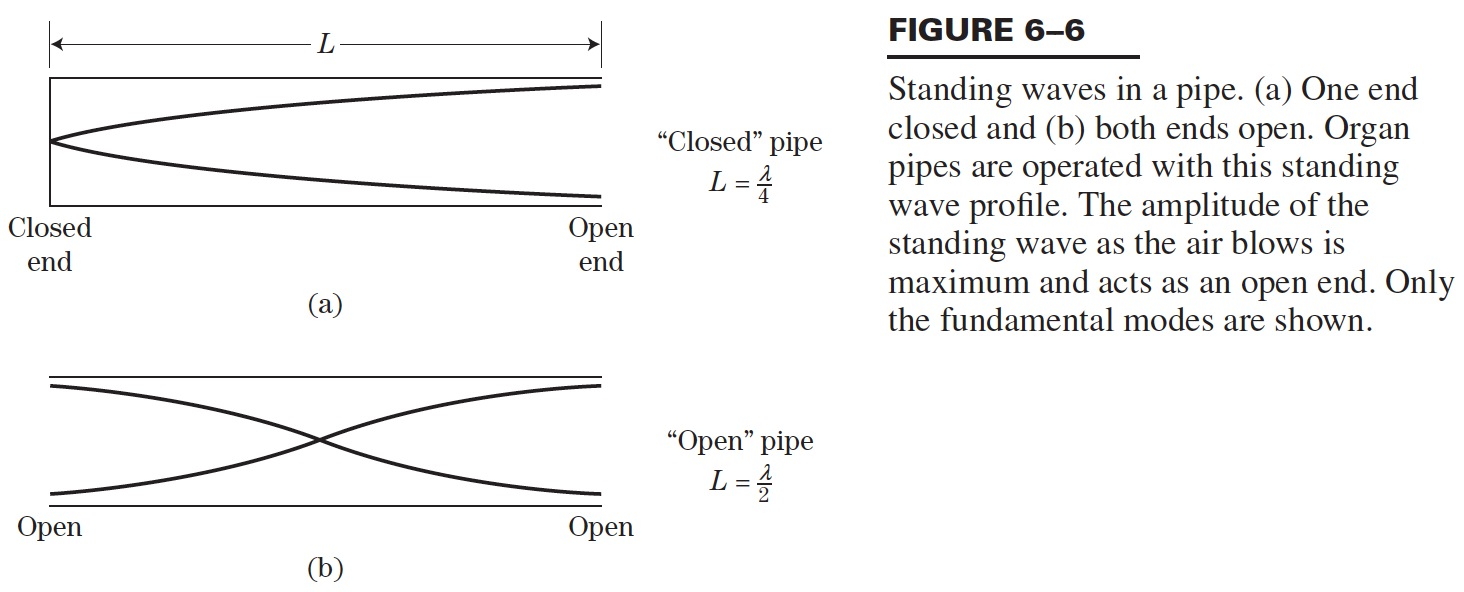
However, sound waves are longitudinal waves and the particle motion associated with a standing sound wave in a pipe is directed along the length of the pipe (back and forth along the pipe axis, or left and right horizontally for the images shown at right). It is a bit more difficult to imagine horizontal motion depicted by graphs that appear to show vertical displacement, and this is the problem I have with most textbook treatments of standing sound waves. For example, Figure 6-6 shown at the right is from a specialized textbook[1] that I used for several years while teaching a junior level physics of waves course to physics majors. The figure caption states that the figure shows "standing waves in a pipe" but does not indicate what quantity (displacement or pressure?) is being represented by this "standing wave profile." The caption also mentions the "amplitude of the standing wave" but again does not define what that amplitude represents. The answer is that he curves in the figure represent the extremes of the horizontal particle displacement amplitude of the air molecules as the standing wave oscillates through a complete cycle, but such an interpretation is not readily apparent from such a graph, and certainly not apparent from this figure caption.
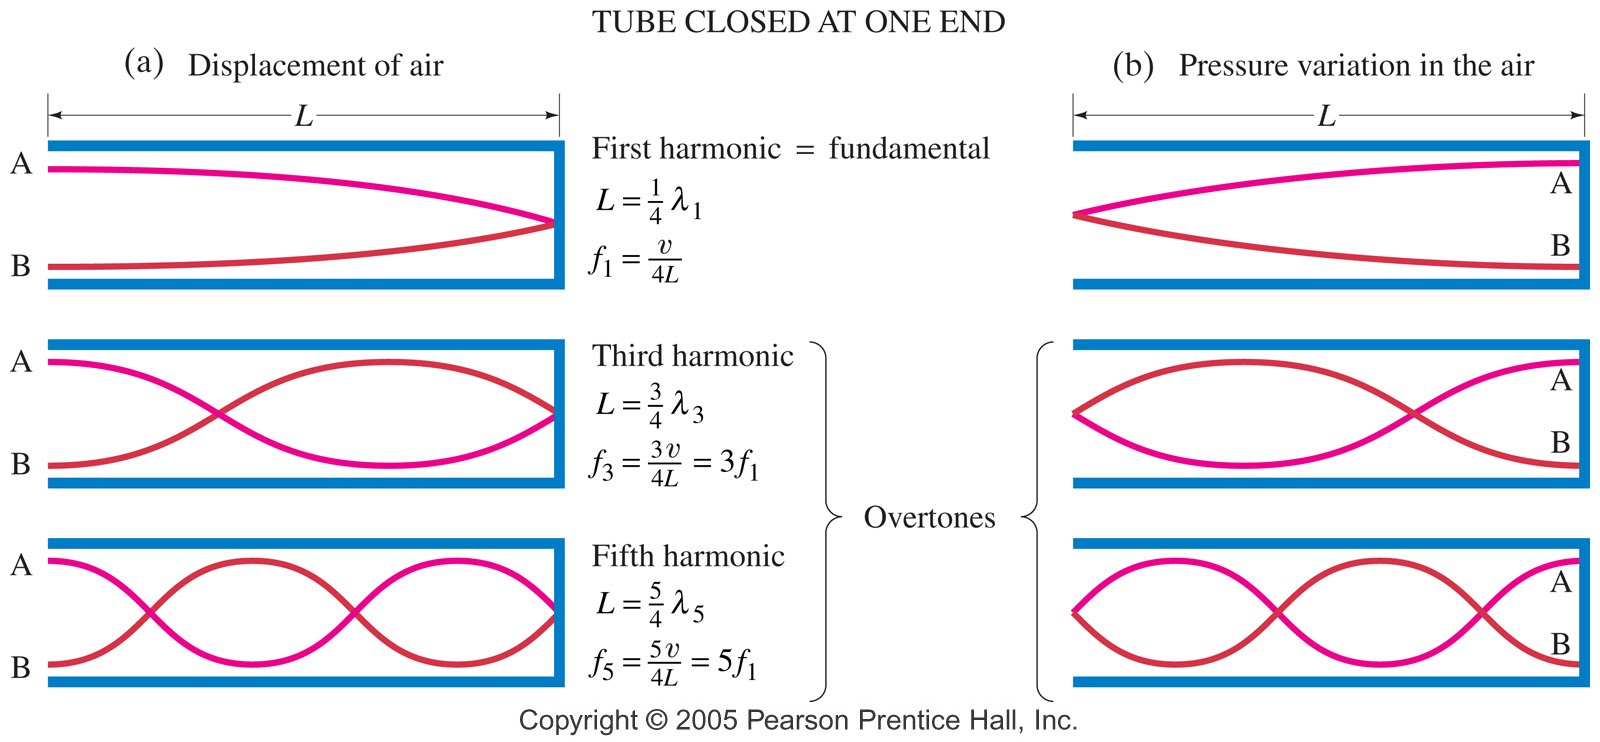
Other textbooks (like the Prentice Hall physics textbook from which the second image at right is borrowed) try to do better by showing two companion sets of graphs, one showing the displacement of air an the other for pressure associated with the sound wave. However, the displacement plots still don't clearly indicate that the displacement amplitude is for a longitudinal horizontal (left-to-right) motion of the air particles.
There are a couple of websites that try to correctly explain what the pictures mean (distinguishing between pressure and longitudinal particle motion):
- PHYS-130 Lecture #19 by Professor Dmitri Pogosian at the University of Alberta
- Open vs Closed pipes (Flutes vs Clarinets) from the University of New South Wales, Sydney, Australia
I created the animation below and its accompanying description in an attempt to better explain the behavior of a standing sound wave in a pipe.

